By Kirill Kalinin and Walter R. Mebane, Jr.
With so much attention on how Russia tried to influence the 2016 U.S. presidential election, it’s easy to forget that Russia had its own election in 2016. And that election, too, has had its democratic legitimacy questioned.---
The 2016 Russian election
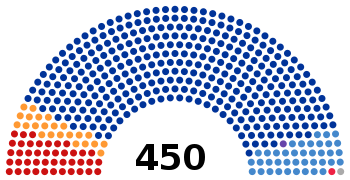
So what happened in Russia? In the September Duma election, Russianscast two ballots. One ballot was called “proportional representation.” On that one, they voted for a party — and then legislative seats were divvied up among the parties to match the proportion of the vote each party won.
We also used a positive empirical model of election frauds, and foundtwo kinds of fraud indicators were vastly higher in 2016 than in earlier years’ elections: incremental fraud, in which some votes appear to be redirected to the winner, and extreme fraud, in which almost all votes go to the winner, which of course is extremely unlikely. In 2016, we concluded that about 3.6 percent of votes recorded for United Russia (nearly two million votes) were fraudulent.
---
And then we find 4.187, which is a very special number
So where’s the finger?
Consider the following statistics for Russia’s 2016 election. We computed both turnout and the total vote for every party that was reported as having more than a million votes in the proportional representation election.
 |
Russia 2016 Duma Election PR Votes Forensic Statistics. Note: 2BL, second-digit mean; LastC, last-digit mean; DipT, p-value from test of unimodality; Obs, number of precinct observations. Estimates in red differ significantly from the values expected if there are no anomalies. Values in parentheses are 95% nonparametric bootstrap confidence intervals. LDPR, Liberal Democratic Party of Russia; KPRF, Communist Party of the Russian Federation.
Data: Russian precinct data used with the Election Forensics Toolkit.
Table: Walter R. Mebane, Jr.
|
----
This paper, written for a grant funded by USAID, describes in detail what all these statistics are.
But to see the oddity, here’s what you have to know. These are among the statistics often cited as indicators of election anomalies. When several of these indicators differ significantly from what was expected, there’s a high probability that the election included fraud.
----
Almost across the board, the statistics differ significantly from expectations.
There are two exceptions.
And this is the special moment. The exceptions are too perfect.
An article by Luis Pericchi and David Torres argues that Benford’s Law (which implies that smaller digits occur more frequently than larger digits) can help us detect anomalies. Chapter 9 in this book of essays about Benford’s Law points out that, given that, the mean of vote counts’ second digits should be 4.187.
To four significant figures, that is the value observed for the mean of the second digit (2BL) of the number of voters in each of 96,869 precincts.
This article by Berndt Beber and Alexandra Scacco argues that each of the 10 possible last digits of vote counts should occur equally often, in which case their mean is 4.5. That is the value observed for the mean of the last digit (LastC) of the votes in each precinct for United Russia.
[Is Putin going to face a “colored revolution"?]
Those two statistics are perfect.
Source: washingtonpost.com
Komentarai
Rašyti komentarą